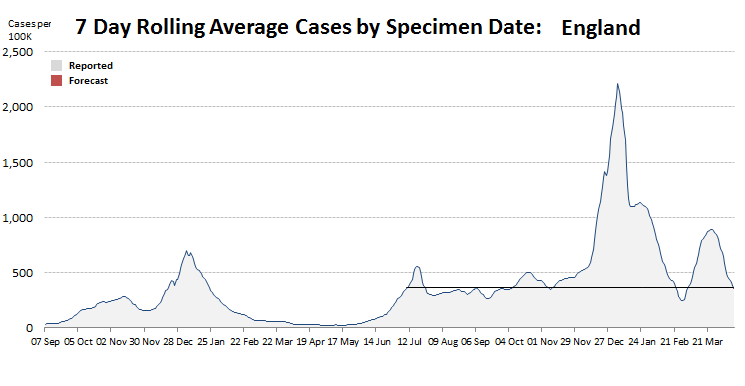
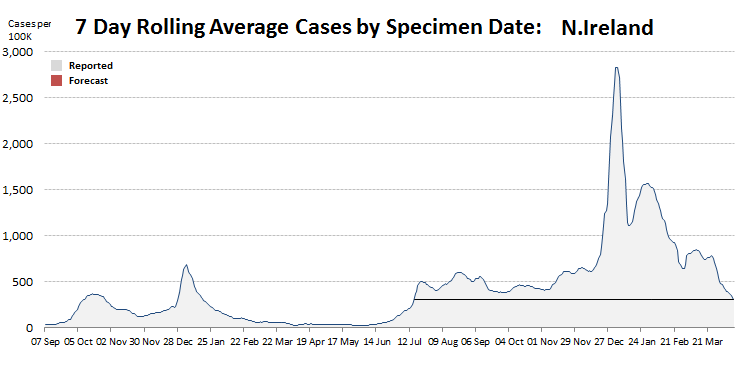
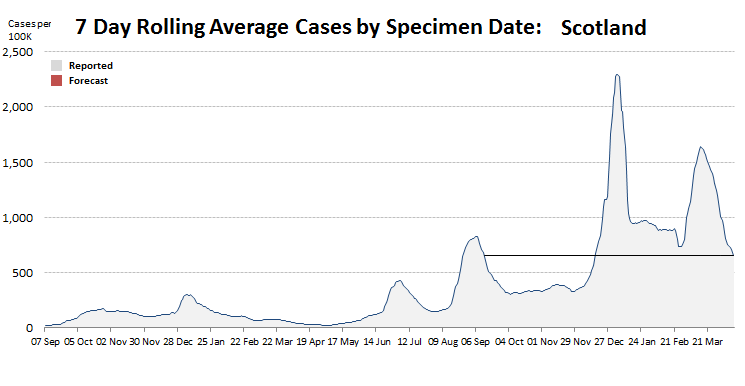
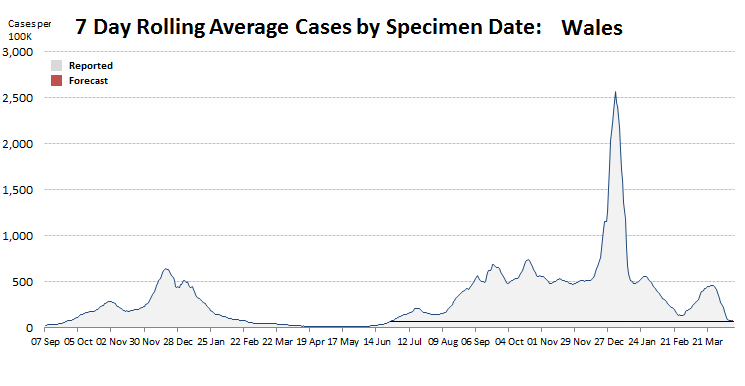
The charts below show the rolling 7-day Covid-19 case rate per 100,000 people. Cases reflect Specimen Date. The black horizontal line on each chart shows the last date when cases were at current levels.