
This example uses the following input data. The values (expressed as percentages) are forecasts for the amount of work arrived and completed each month.
Management also want to see best case and worst case assumptions. For this example, the best case is 10% above forecast and the worst case is 10% below forecast.
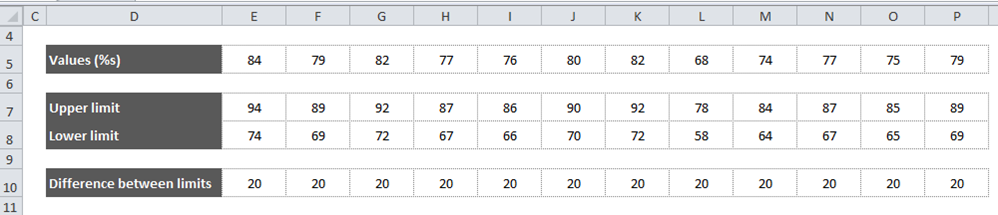
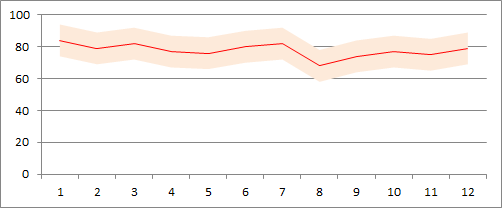
In the data table, row 5 contains the actual values. Rows 7 and 8 hold the calculated upper and lower tolerance limits, and row 10 calculates the difference between these two limits.
The first step is to create a Stacked Area Chart that uses the Lower Limit and Difference data (rows 8 and 10).
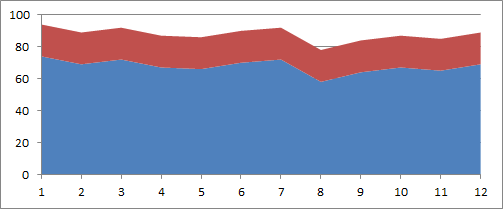
With this default Stacked Area Chart, the next step is to style the two areas. The fill colour should be removed from the Lower Limit series. Choose your preferred colour for the Difference series.
The Values data can now be added to the chart. Select the Values range of cells in the spreadsheet and click on Copy. Then, select the Chart and click on the drop-down arrow below the Paste icon on the main menu; choose Copy Special. Finally, make sure that the Select as Series option is checked before clicking OK. By default, Excel treats this series as part of the Stacked Area chart and puts it above the other two series.
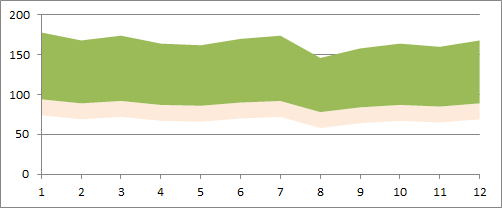
Next, right-click on this new series and choose Change Series Chart Type from the pop-up menu. Choose your preferred Line Chart type for this series and then style it to suit your design.
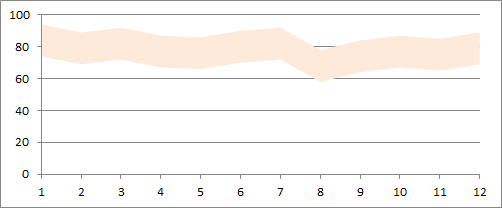
One way to emphasise the boundaries of the tolerance range is to show each of the upper and lower limit values as separate lines. To do this, repeat the previous two steps for the series in rows 7 and 8. In turn, add each series to the chart, change the series type to Line and update the series styles.
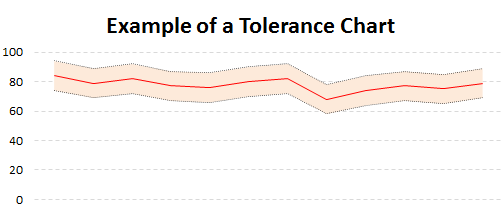
Tolerance Charts are simple to create and are great at showing uncertainty or ranges in your data.
This technique can be applied in many other situations within Excel.